Technology
Nomadic Software
One solution for
your entire fleet.
Monitor all assets, view live camera feeds, track drone positions, and access real-time sensor data from anywhere.
Monitor all assets, view live camera feeds, track drone positions, and access real-time sensor data from anywhere.
Get all your sensor data exactly where your team needs it. Our platform streams telemetry from every Nomad on your grid into a single, accessible solution. No scattered systems or data silos, just clear, continuous data ready for your engineers and operators to act on immediately.
.png)
.png)
See exactly where your Nomads are in relation to your critical infrastructure. Our interactive map plots your active sensors directly alongside towers, substations, multi-voltage lines, and power production sites. Understand localized bottlenecks instantly by viewing real-time sensor data in its exact geographical context.
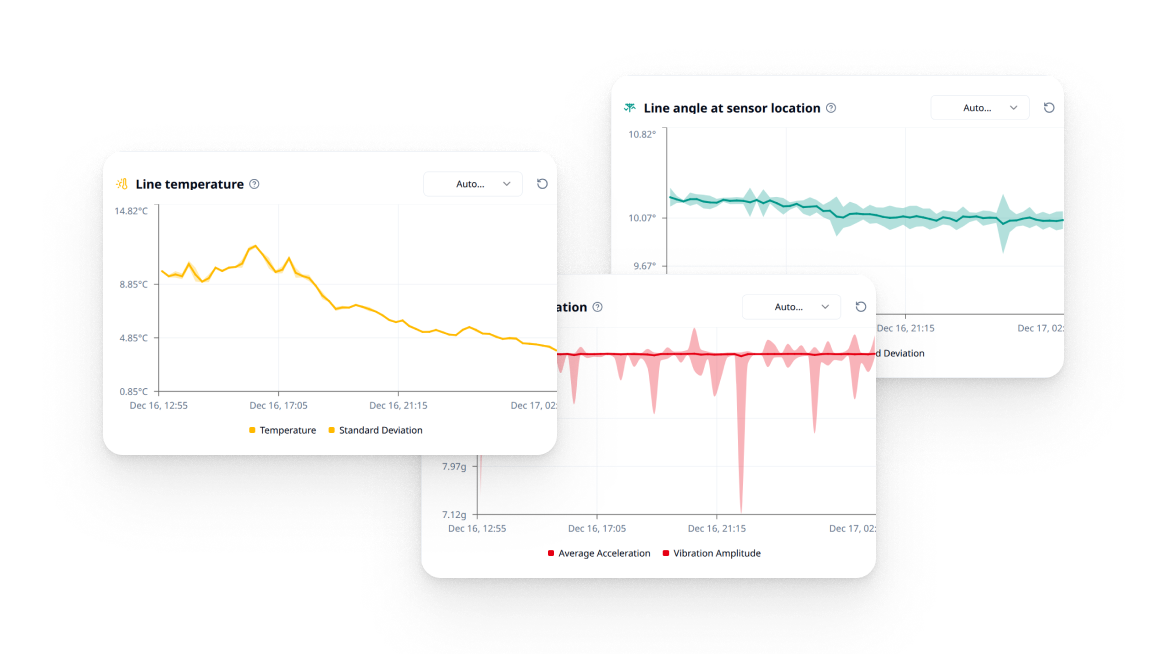
Pinpoint any moment on the timeline. With sensor telemetry captured at precise 10-second intervals, you can isolate exactly when a thermal spike began, how a high-wind event unfolded, or where a trend first appeared. Forensic-level detail across your entire grid.
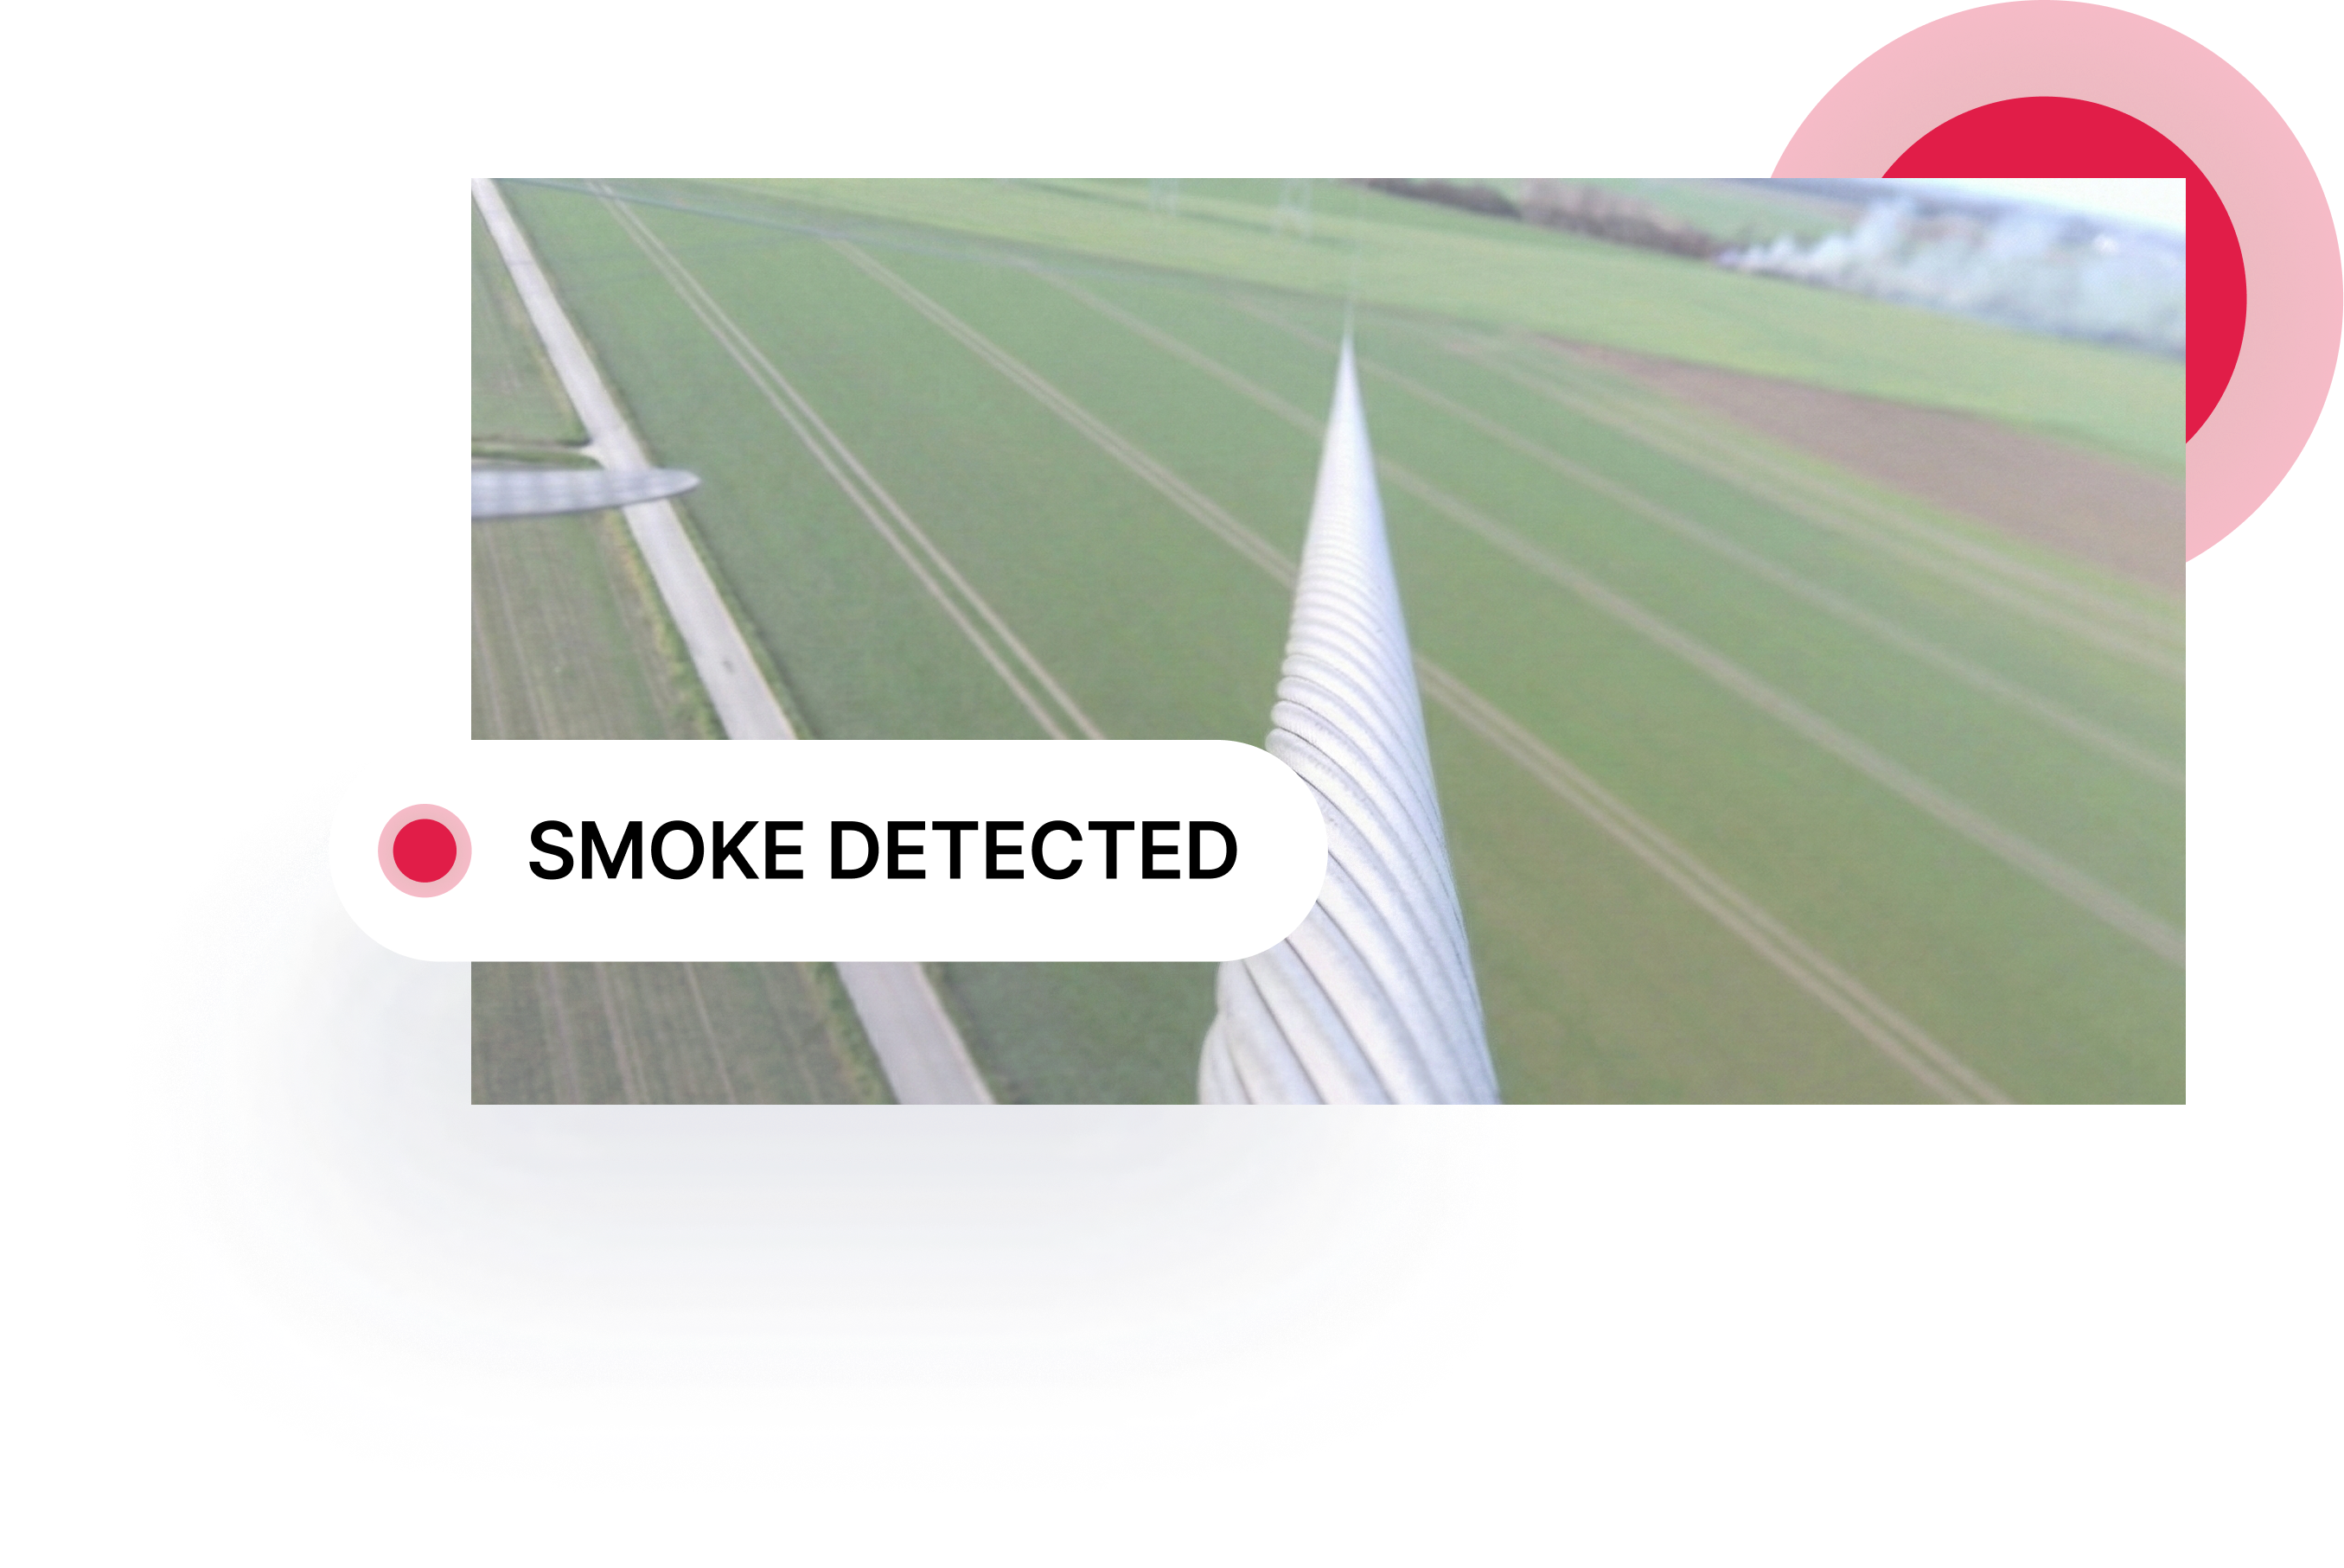
Define your own operational limits and let the platform do the monitoring. Set specific thresholds for conductor temperature, sag angle, vibration, or camera triggers. When an event occurs, your team receives an immediate, automated alert, ensuring you only spend time looking at the data that requires action.